In the last eight years, we have unlocked benefits worth over INR 14,000 crore for close to 50 lakh customers and over 40,000 businesses in more than 24 states.
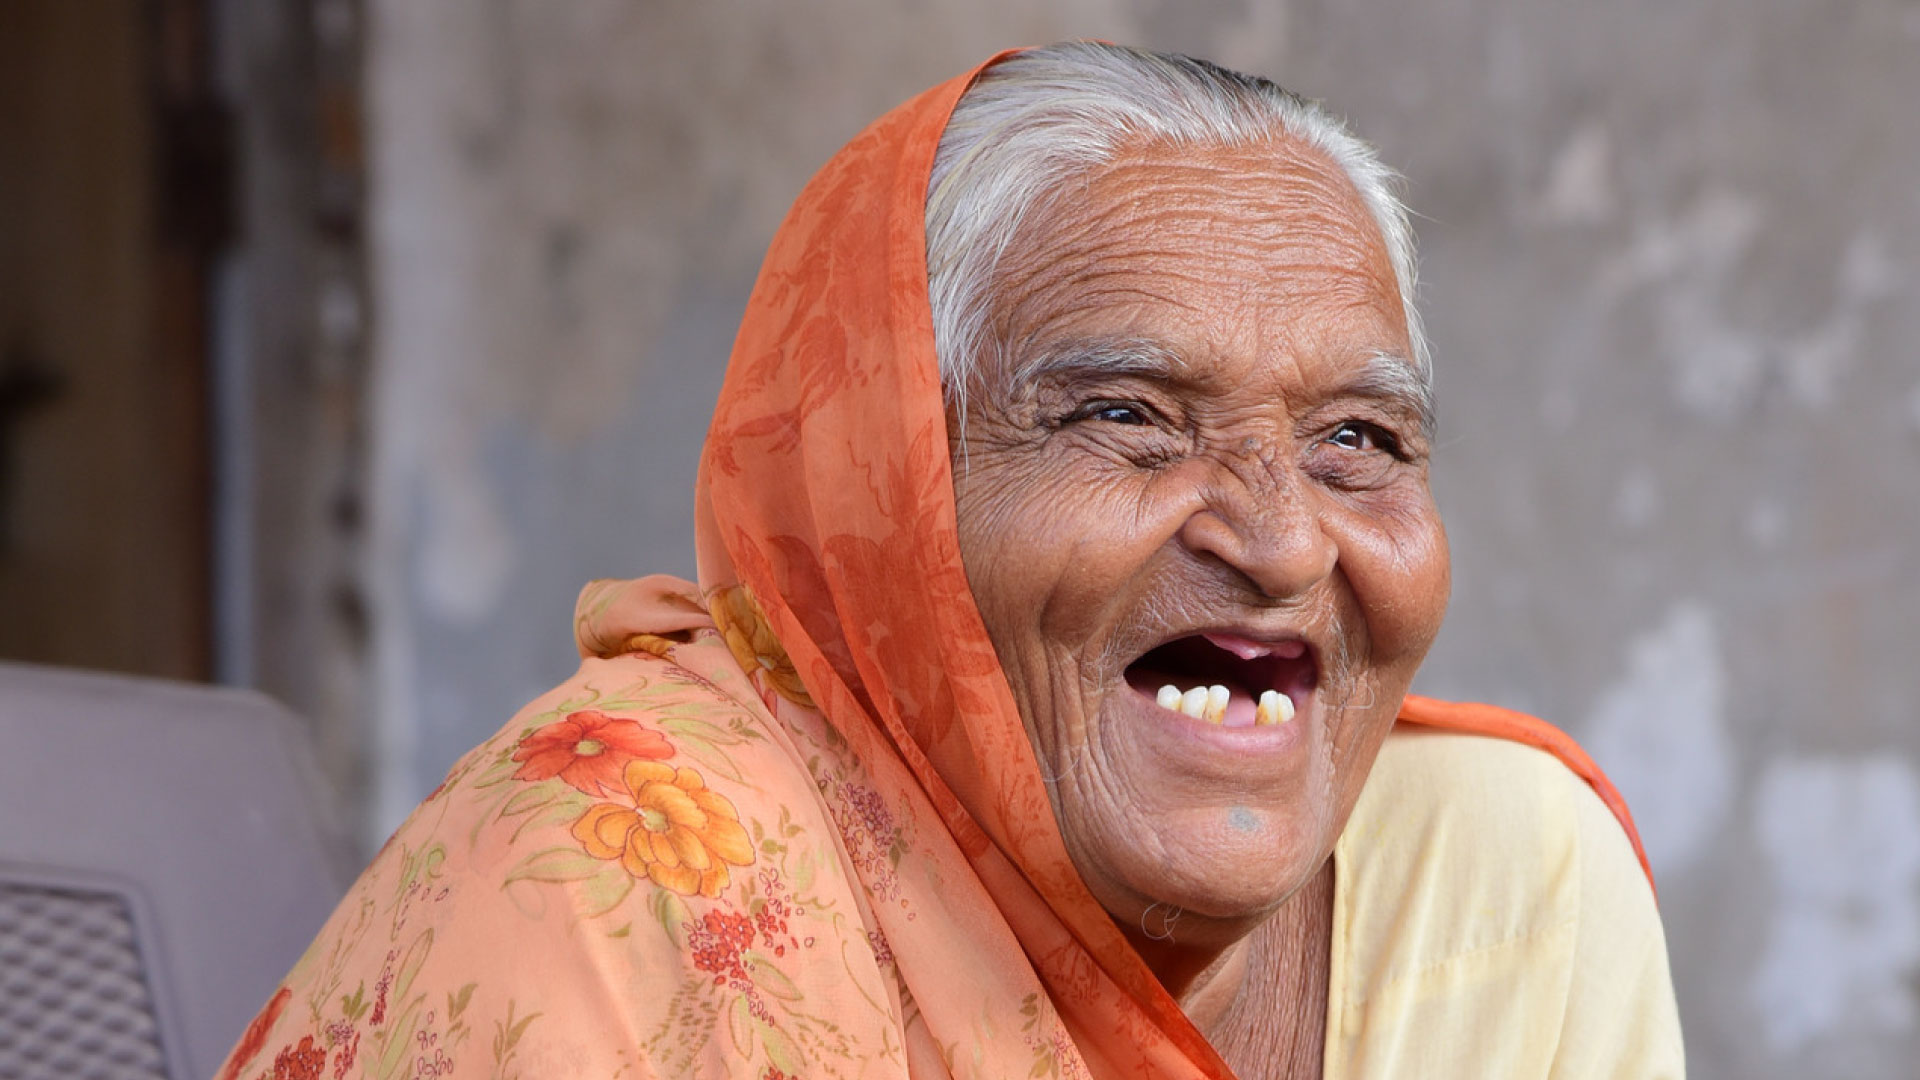
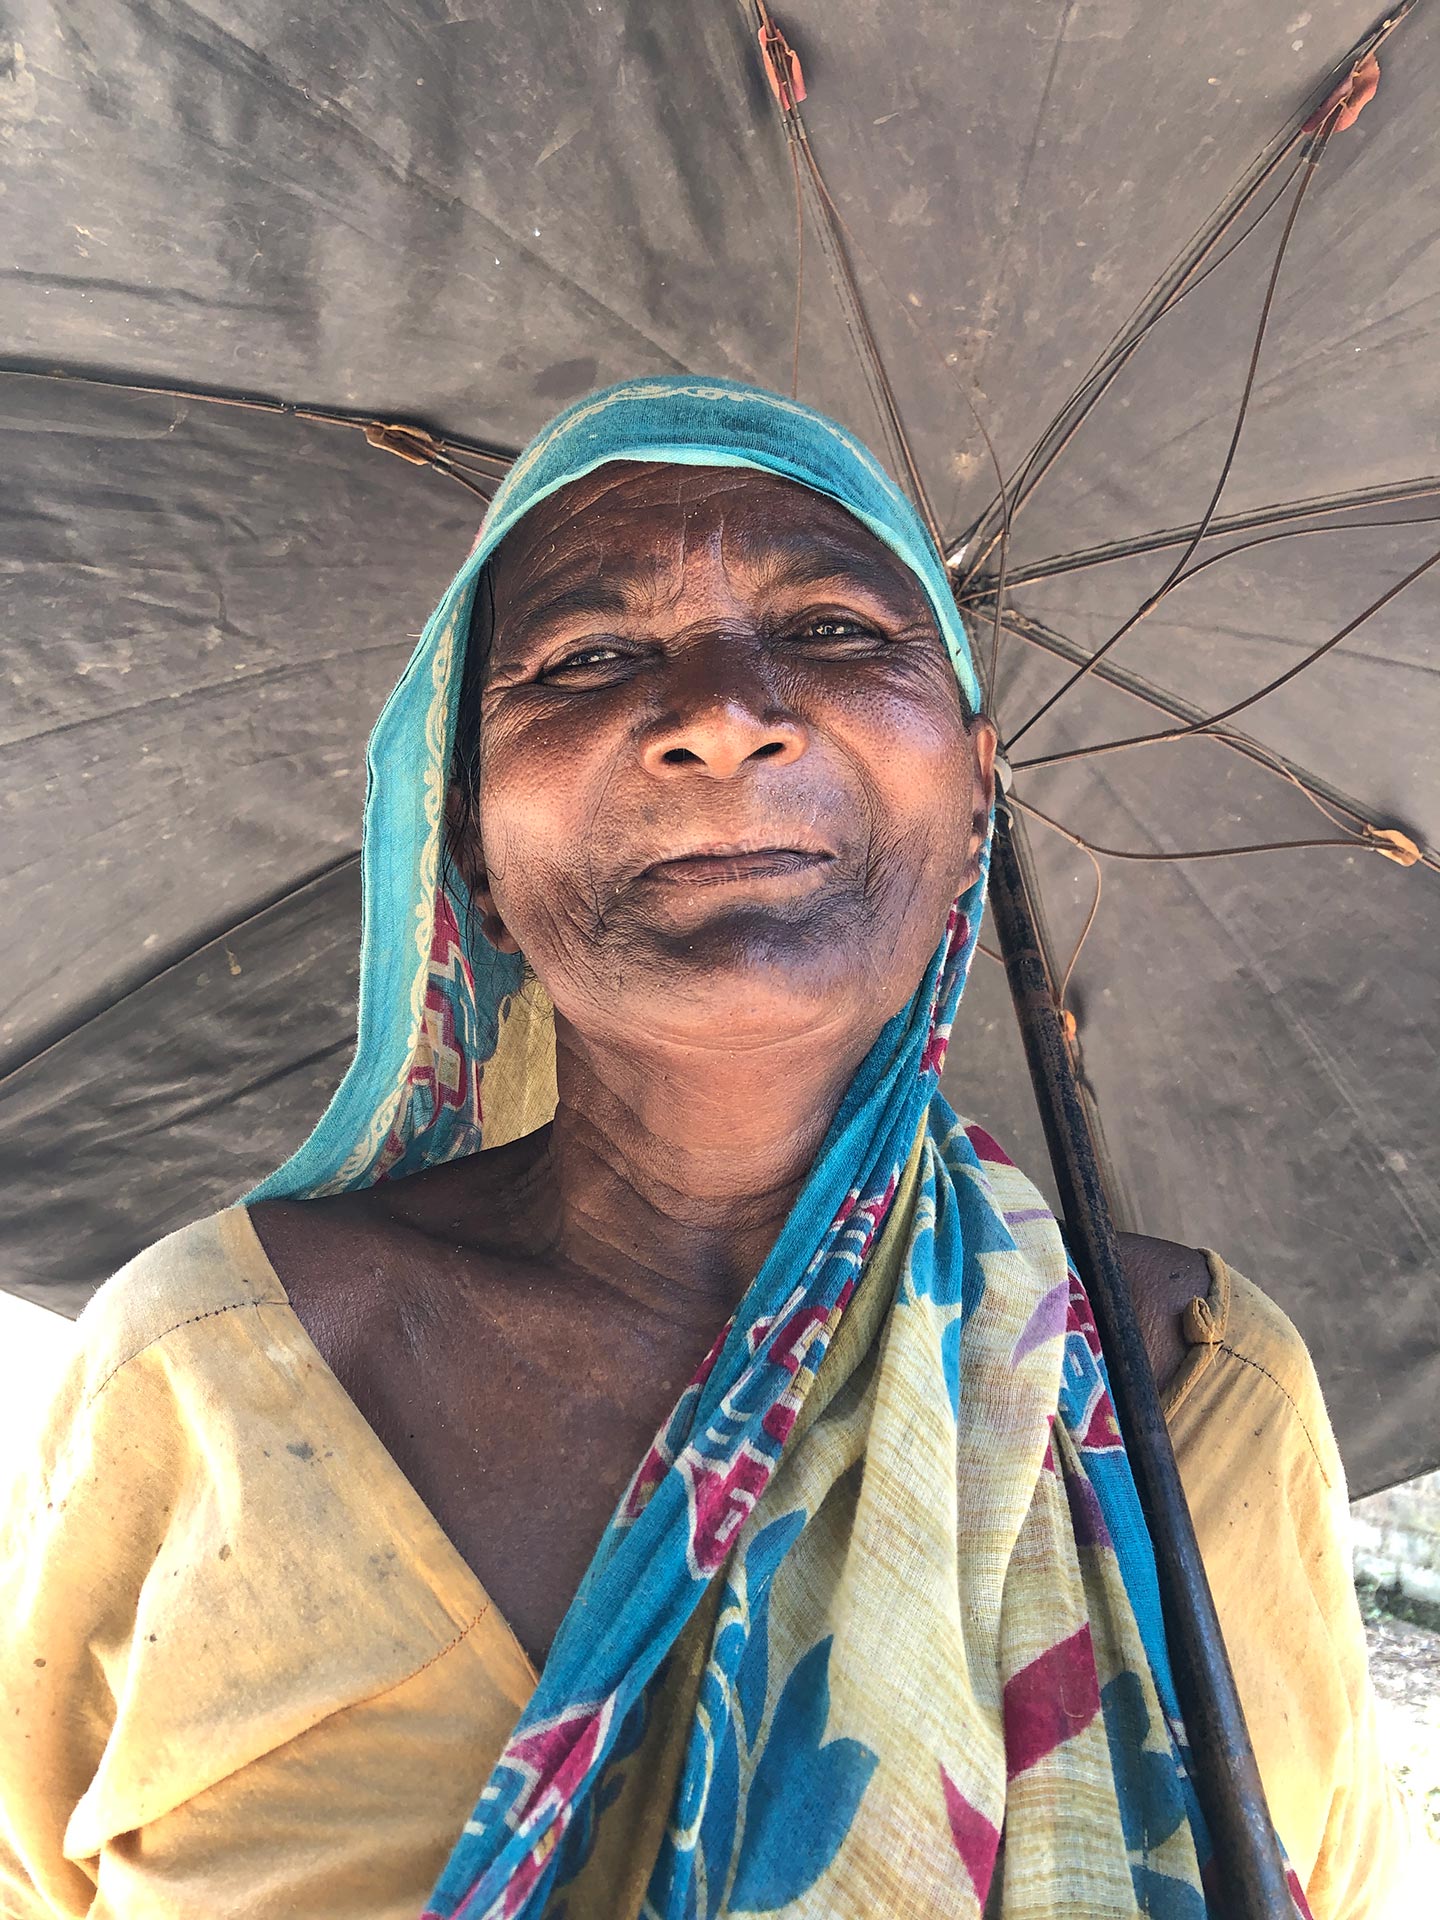
We have serviced 112 trades including fishermen, farmers, construction workers, sanitation workers, well diggers, ‘raj mistries’, mine workers, sex workers, handloom weavers, domestic workers, cobblers, leather workers, even Kendu leaf collectors and toddy tappers!
We have managed to get farmers (one of our major target cohorts) access to credit, tech, and equipment that can help them protect their crops and better their yield in villages that still don’t have roads, power, or even water.
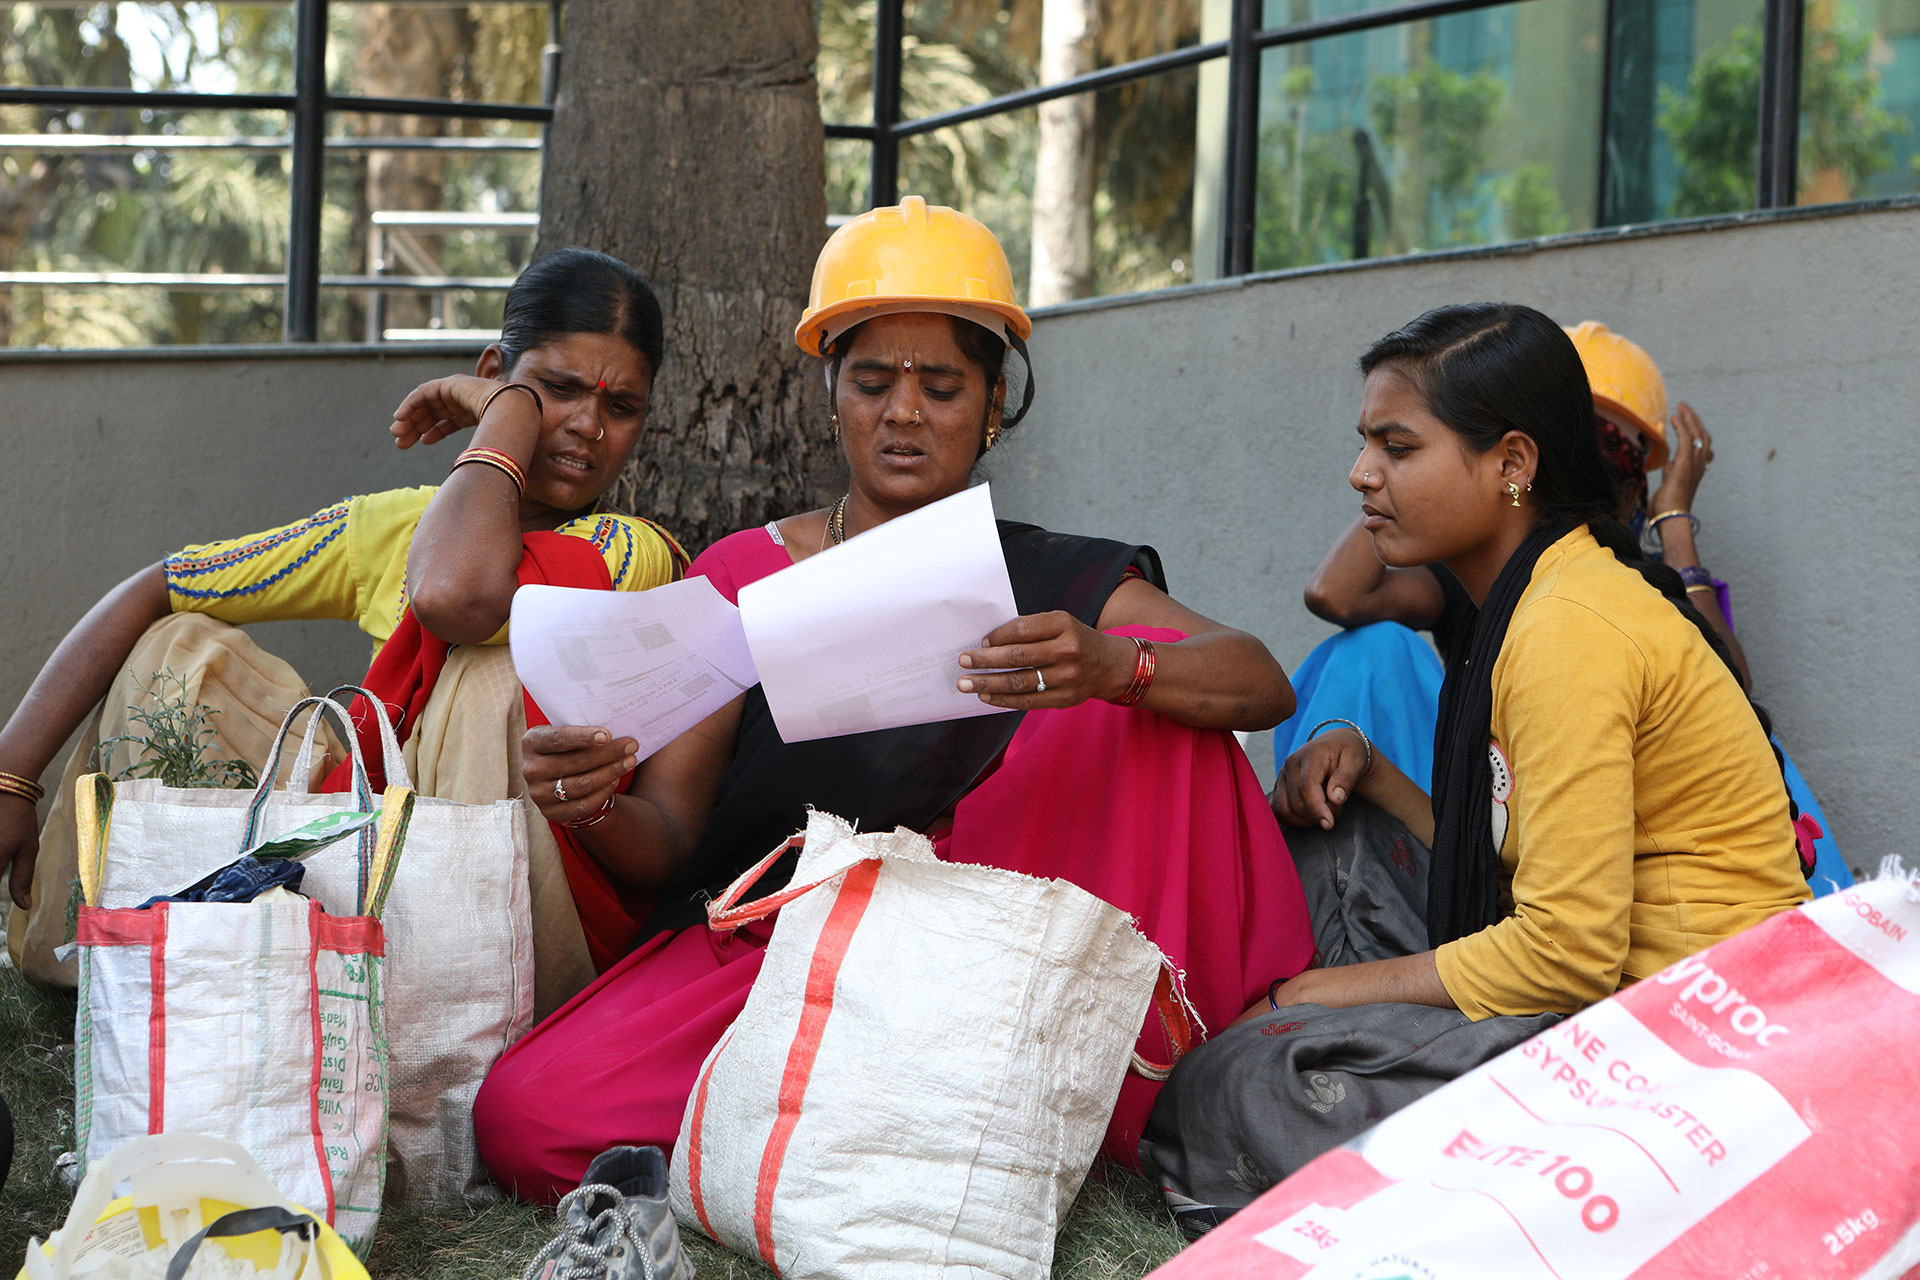
We have trained 22,773 women Agents who have had to fight through deeply entrenched biases within their communities, often in places with a terrifying history of violence towards women, to fearlessly carve out identities of their own and establish themselves as equals.
Aniket was awarded the Social Entrepreneur of the Year Award, 2022 by The Schwab Foundation. Shortly after, he attended the World Economic Forum in Davos in 2023. In the same year, Shark Tank made us a household name.
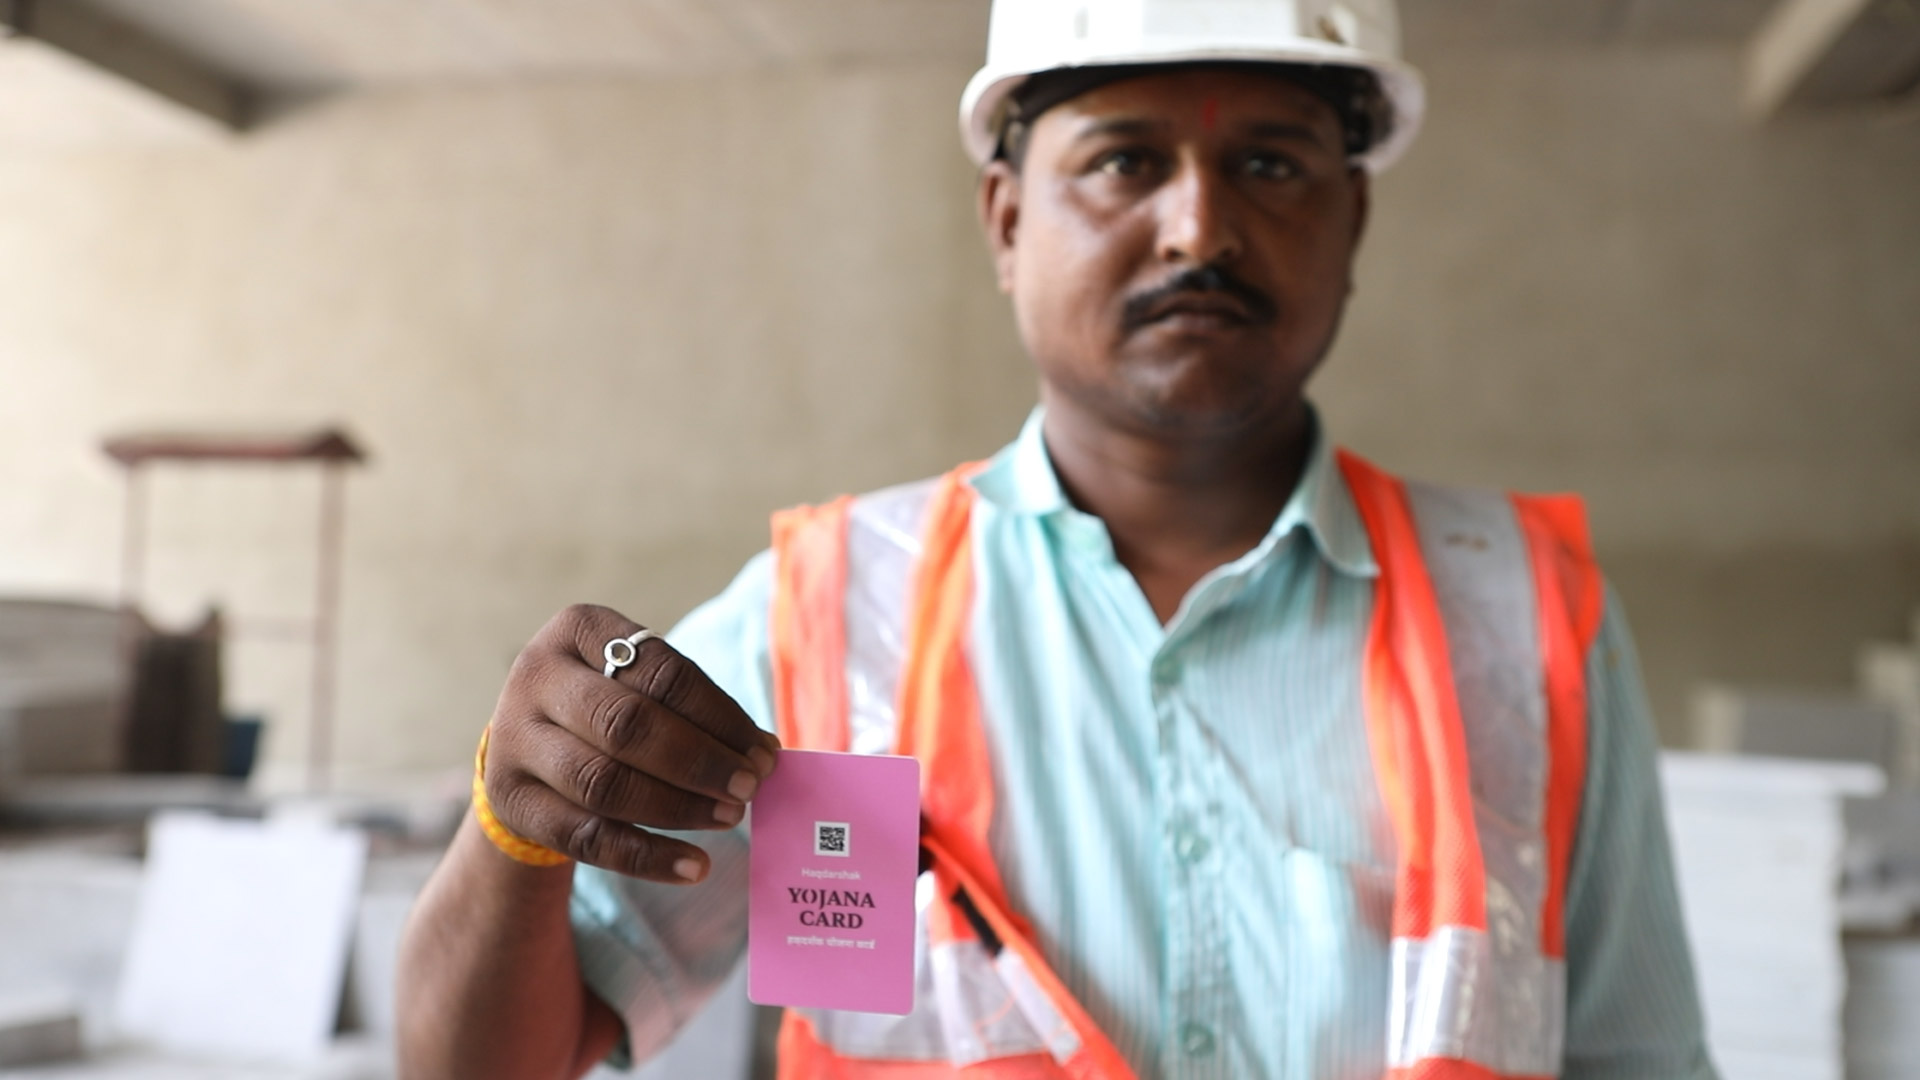
Today, our team consists of over 450 people. We have 4 offices in 4 major cities. We have 57 active Yojana Kendras in 20 states. We have dispatched close to 12,000 Yojana Cards. We’re launching a bank-linked Yojana Card which will be integrated with financial services, something that will revolutionise the way social protection is accessed in India (and possibly, even the world).
We have hit a scale that was only a dream back in 2016. We’re now gearing up for an audacious target of reaching 100 million customers by 2030.
We will be releasing a detailed impact report soon.
Just like last year, we have distributed our impact numbers across various sections —
01/ Vehicles for Sustainable Change — Our Cumulative Reach
02/ Building Positive Socio-Economic Outcomes — Our Geographical Reach
03/ Our Contribution to the Enrollment of Citizens in Flagship Schemes
04/ Thematic Impact Areas
05/ Documentation — A Critical Need
06/ Geographical Impact
07/ Target Cohorts
Notes:
Benefit Value Unlocked and Agent Earnings
— Revised Numbers
On the Revision of Benefit Value Unlocked
Over the past 8 years of working with citizens at the last mile, we have gained valuable insights into the realities of the impact of social protection schemes and essential document access. Over time, these learnings, backed by secondary research, have prompted us to refine our approach to quantifying the benefits of these schemes to capture their true potential more accurately.
With this revision, we have made an effort to capture aspects like hidden savings, ripple effects, and other dimensions some key schemes and documents entail, beyond just the direct and tangible benefits of welfare services and direct benefit transfers.
For example, in our previous calculations of the benefit value unlocked for insurance schemes, we primarily considered the savings in premiums compared to similar private insurance. For a more holistic picture, however, it is important to account for the broader impact of such schemes, such as their role in preventing distress borrowings and the resulting savings on financing costs.
Basic identification documents also play a crucial role in enabling social security. Possessing them is fundamental to unlocking a range of scheme benefits. While quantifying the benefit value of a document itself may seem less significant at first glance, a closer look highlights the importance of considering its practical applications — especially when it comes to schemes where the document in question is indispensable.
In these cases, factors like the number of intended beneficiaries, budget allocations, and actual expenditures of such schemes become necessary considerations.
We believe that this revised approach to quantifying the benefit value unlocked offers a more realistic and thorough depiction of the extensive impact that can potentially be unlocked through documents and welfare programs.
On the Revision of Agent Earnings
Until 2022, the ‘Agent Earnings’ figure exclusively represented the direct earnings generated by ‘Haqdarshaks’ from end users.
However, as of 2023, this figure will include the direct earnings from end users as well as the income accrued by our Agents through partner-sponsored projects.
In these projects, the ‘Haqdarshaks’ fee, which would typically be borne by the end user, has been wholly or partially subsidized by our valued partners.
01/
Vehicles for Sustainable Change
— Our Cumulative Reach
Linkages to social protection are more about long-term sustainability than the immediate benefits they provide. In fact, welfare programmes help build resilience in the long run and enable improvement across various stages of the welfare value chain.
To date, we have impacted more than 4.9 million citizens and 41,553 businesses! Below is a snapshot of our overall numbers.

Total Value of
Benefits Unlocked
INR 14,000 Cr
(Apr 2015 – Nov 2023)
INR 5,541 Cr
(Jan – Nov 2023)

Number of
Citizens Reached
4.95 Million
(Apr 2015 – Nov 2023)
2.28 Million
(Jan – Nov 2023)

Number of
Applications Submitted
4.64 Million
(Apr 2015 – Nov 2023)
2.34 Million
(Jan – Nov 2023)

Number of
Benefits Delivered
4.36 Million
(Apr 2015 – Nov 2023)
2.28 Million
(Jan – Nov 2023)

Number of
MSMEs Reached
41,553
(Apr 2015 – Dec 2023)
4,916
(Jan – Nov 2023)

Number of
Agents Trained
34,196
(Apr 2015 – Nov 2023)
7,592
(Jan – Nov 2023)
Agent
Earnings
INR 9 Cr
(Apr 2015 – Nov 2023)
02/
Building Positive Socio-Economic Outcomes
— Our Geographical Reach
From Nagaland to Gujarat, from Kashmir to Tamil Nadu, we have worked across 29 states and Union Territories! While this is a significant number for a social impact startup, it’s still a drop in the ocean considering the number of families in need of social protection. We have miles to go but a big shoutout to each member of every field team at HQ — this would not have been possible without your support.
States
24
(Apr 2015 – Nov 2023)
UTs
5
(Apr 2015 – Nov 2023)
Districts
479
(Apr 2015 – Nov 2023)
Talukas
3047
(Apr 2015 – Nov 2023)
Villages
10,328
(Apr 2015 – Nov 2023)
Pin Codes
1,191
(Apr 2015 – Nov 2023)
03/
Our Contribution to the Enrollment of Citizens
in Flagship Schemes
Flagship welfare programmes by the Government of India address key concerns including access to healthcare, nutrition, education, employment, housing, financial security, and social security. Some flagship schemes have been designed to move the needle on climate change and gender equality, while others support agricultural workers and nano and micro enterprises to increase productivity. Through camps and door-to-door outreach, we have helped bring greater awareness about these flagship schemes, all the while assisting citizens in unlocking their benefits.

Ration Cards: National Food Security Act
INR 2,45,68,39,840
(Apr 2015 – Nov 2023)
INR 26,99,09,360
(Jan – Nov 2023)

Ayushman
Bharat
INR 24,12,36,85,398
(Apr 2015 – Nov 2023)
INR 11,93,09,41,862
(Jan – Nov 2023)

PM Jan Dhan Yojana
INR 1,13,81,300
(Apr 2015 – Nov 2023)
INR 25,17,200
(Jan – Nov 2023)

MGNREGA
INR 1,08,95,66,543
(Apr 2015 – Nov 2023)
INR 44,30,78,219
(Jan – Nov 2023)

PM Awas Yojna
INR 26,80,10,000
(Apr 2015 – Nov 2023)
INR 16,50,000
(Jan – Nov 2023)

Scholarships
INR 3,46,06,920
(Apr 2015 – Nov 2023)
INR 44,32,560
(Jan – Nov 2023)

Sukanya Samriddhi Yojana
INR 1,83,48,195
(Apr 2015 – Nov 2023)
INR 10,65,108
(Jan – Nov 2023)

PM Ujjwala Yojana
INR 1,86,59,850
(Apr 2015 – Nov 2023)
INR 7,34,650
(Jan – Nov 2023)

PM Jeevan Jyoti
Bima Yojana
INR 8,95,53,83,171
(Apr 2015 – Nov 2023)
INR 2,05,71,07,204
(Jan – Nov 2023)

PM Suraksha
Bima Yojana
INR 10,53,33,49,057
(Apr 2015 – Nov 2023)
INR 3,04,51,63,275
(Jan – Nov 2023)

Atal Pension
Yojana
INR 21,10,44,360
(Apr 2015 – Nov 2023)
INR 5,79,06,840
(Jan – Nov 2023)

PM Garib Kalyan
Anna Yojana
INR 7,07,94,300
(Apr 2015 – Nov 2023)
INR 11,700
(Jan – Nov 2023)

PM Kisan
Samman Nidhi
INR 32,45,09,063
(Apr 2015 – Nov 2023)
INR 3,34,89,780
(Jan – Nov 2023)

PM Fasal
Bima Yojana
INR 79,21,16,135
(Apr 2015 – Nov 2023)
INR 53,67,93,410
(Jan – Nov 2023)

PM Shram Yogi
Maandhan Yojana
INR 1,50,52,156
(Apr 2015 – Nov 2023)
INR 64,35,579
(Jan – Nov 2023)

PM Mudra
Yojana
INR 1,76,92,858
(Apr 2015 – Nov 2023)
INR 39,55,040
(Jan – Nov 2023)

Indira Gandhi National
Old Age Pension
INR 9,18,58,57,137
(Apr 2015 – Nov 2023)
INR 7,18,19,155
(Jan – Nov 2023)

Indira Gandhi National
Widow Pension
INR 7,48,71,600
(Apr 2015 – Nov 2023)
INR 91,62,000
(Jan – Nov 2023)

Indira Gandhi National
Disability Pension
INR 31,48,77,000
(Apr 2015 – Nov 2023)
INR 7,05,600
(Jan – Nov 2023)
Other Key Schemes

BOCW (Building and Other Construction Workers)
INR 30,47,55,591
(Apr 2015 – Nov 2023)
INR 10,90,90,009
(Jan – Nov 2023)

PM’s Street Vendor’s Atma Nirbhar Bharat (SVANidhi)
INR 3,48,65,088
(Apr 2015 – Nov 2023)
INR 10,656
(Jan – Nov 2023)

e-Shram
INR 35,84,05,90,223
(Apr 2015 – Nov 2023)
INR 11,65,19,44,535
(Jan – Nov 2023)

FSSAI License
INR 1,48,000
(Apr 2015 – Nov 2023)
INR 47,500
(Jan – Nov 2023)
Shop Act
INR 47,25,90,294
(Apr 2015 – Nov 2023)
INR 22,34,32,047
(Jan – Nov 2023)
04/
Focus Areas
Our impact cuts across major thematic areas in alignment with the UN’s Sustainable Development Goals (SDGs). Note that we are sector-agnostic — all schemes that we help build pathways for are ultimately aimed at reducing inequality.

Food Security and Poverty Alleviation
INR 5,12,63,49,652
(Apr 2015 – Nov 2023)
INR 1,59,59,97,677
(Jan – Nov 2023)

Climate and Sustainable Development
INR 6,80,39,842
(Apr 2015 – Nov 2023)
INR 2,93,51,628
(Jan – Nov 2023)

Agriculture
INR 1,98,09,76,962
(Apr 2015 – Nov 2023)
INR 50,26,93,522
(Jan – Nov 2023)

Relief
INR 4,09,62,330
(Apr 2015 – Nov 2023)
INR 42,54,050
(Jan – Nov 2023)

Gender and Reproductive Rights
INR 3,52,00,830
(Apr 2015 – Nov 2023)
INR 47,71,250
(Jan – Nov 2023)

Social Security and Financial Inclusion
INR 49,04,10,88,413
(Apr 2015 – Nov 2023)
INR 14,59,34,13,317
(Jan – Nov 2023)

Livelihood and Skill Development
INR 5,45,51,05,503
(Apr 2015 – Nov 2023)
INR 4,15,09,39,370
(Jan – Nov 2023)

Health Care and Insurance
INR 46,16,38,22,825
(Apr 2015 – Nov 2023)
INR 23,51,01,48,590
(Jan – Nov 2023)

Education
INR 6,52,52,532
(Apr 2015 – Nov 2023)
INR 1,43,41,514
(Jan – Nov 2023)
05/
Documentation — A Critical Need
Identity documents with accurate information, whether for KYC, compliance, or regulatory purposes, are the first step towards accessing benefits, and therefore, are a critical need for building an efficient social protection infrastructure. Most of the citizens we serve don’t have an Aadhaar card or say, a Caste Certificate; or even if they have an Aadhaar card, it probably hasn’t been seeded to their bank account which makes it impossible for them to receive benefits. These are problems we have identified over the years and have gotten better at solving. Plus, our ability to liaise with both government and bank officials gives us an edge — we are now faster, better, and more efficient.

PAN Card
INR 1,30,65,040
(Apr 2015 – Nov 2023)
INR 21,80,460
(Jan – Nov 2023)

Aadhar Card
INR 17,61,730
(Apr 2015 – Nov 2023)
INR 2,56,250
(Jan – Nov 2023)

Ayushman Bharat
Health Account
INR 2,73,97,250
(Apr 2015 – Nov 2023)
INR 1,33,39,350
(Jan – Nov 2023)

eKYC: Aadhaar Linkages
and Seeding
INR 6,37,90,56,616
(Apr 2015 – Nov 2023)
INR 1,05,00,36,158
(Jan – Nov 2023)

Unique Disability ID
INR 44,93,668
(Apr 2015 – Nov 2023)
INR 81,040
(Jan – Nov 2023)

Caste Certificate
INR 49,64,04,800
(Apr 2015 – Nov 2023)
INR 15,94,87,560
(Jan – Nov 2023)
Disability Certificate
INR 33,950
(Apr 2015 – Nov 2023)
INR 16,600
(Jan – Nov 2023)

Income Certificate
INR 4,62,25,95,912
(Apr 2015 – Nov 2023)
INR 2,20,42,93,421
(Jan – Nov 2023)

Udyam Registration
INR 13,68,74,900
(Apr 2015 – Nov 2023)
INR 2,40,07,770
(Jan – Nov 2023)

Aadhar Card Updates
and Corrections
INR 29,11,670
(Apr 2015 – Nov 2023)
INR 19,99,070
(Jan – Nov 2023)

Ration Card Updates
and Corrections
INR 63,44,52,000
(Apr 2015 – Nov 2023)
INR 51,84,84,400
(Jan – Nov 2023)
06/
Pan-India Performance
Haqdarshak’s regional teams — North, West, South, East, and Central — focus on building capacities and strengthening our services and partnerships in each region. Here is a snapshot of our work across the country.
*All numbers below reflect the benefit value unlocked by us.

Andhra Pradesh
INR 7,20,84,63,853
(Apr 2015 – Nov 2023)
INR 5,72,17,39,290
(Jan – Nov 2023)

Assam
INR 36,60,36,474
(Apr 2015 – Nov 2023)
INR 11,85,85,016
(Jan – Nov 2023)

Bihar
INR 1,30,61,74,616
(Apr 2015 – Nov 2023)
INR 44,34,96,687
(Jan – Nov 2023)

Chandigarh
INR 1,08,96,893
(Apr 2015 – Nov 2023)
INR 0
(Jan – Nov 2023)

Chhattisgarh
INR 14,04,55,11,438
(Apr 2015 – Nov 2023)
INR 2,90,43,19,745
(Jan – Nov 2023)

Dadra and Nagar Haveli + Daman and Diu
INR 7,100,749
(Apr 2015 – Nov 2023)
INR 0
(Jan – Nov 2023)

Delhi
INR 2,64,78,75,558
(Apr 2015 – Nov 2023)
INR 49,34,36,517
(Jan – Nov 2023)

Gujarat
INR 7,10,81,48,689
(Apr 2015 – Nov 2023)
INR 3,78,75,63,841
(Jan – Nov 2023)

Haryana
INR 1,82,70,13,352
(Apr 2015 – Nov 2023)
INR 41,15,67,044
(Jan – Nov 2023)

Himachal Pradesh
INR 1,59,82,87,800
(Apr 2015 – Nov 2023)
INR 34,72,72,259
(Jan – Nov 2023)

Jammu and Kashmir
INR 2,46,28,36,216
(Apr 2015 – Nov 2023)
INR 1,49,82,14,901
(Jan – Nov 2023)

Jharkhand
INR 5,31,93,56,648
(Apr 2015 – Nov 2023)
INR 2,01,65,79,913
(Jan – Nov 2023)

Karnataka
INR 5,40,40,04,795
(Apr 2015 – Nov 2023)
INR 1,66,23,05,779
(Jan – Nov 2023)

Kerala
INR 10,62,41,164
(Apr 2015 – Nov 2023)
INR 2,68,33,686
(Jan – Nov 2023)

Madhya Pradesh
INR 18,03,88,76,155
(Apr 2015 – Nov 2023)
INR 6,34,62,25,287
(Jan – Nov 2023)

Maharashtra
INR 18,23,50,59,124
(Apr 2015 – Nov 2023)
INR 5,84,57,09,693
(Jan – Nov 2023)

Manipur
INR 6,26,77,885
(Apr 2015 – Nov 2023)
INR 0
(Jan – Dec 2023)

Meghalaya
INR 22,08,95,485
(Apr 2015 – Nov 2023)
INR 21,96,67,431
(Apr 2015 – Nov 2023)

Nagaland
INR 1,35,79,005
(Apr 2015 – Nov 2023)
INR 0
(Jan – Nov 2023)

Odisha
INR 2,09,49,04,168
(Apr 2015 – Nov 2023)
INR 87,41,85,113
(Jan – Nov 2023)

Puducherry
INR 1,97,09,007
(Apr 2015 – Nov 2023)
INR 0
(Jan – Dec 2023)

Punjab
INR 1,67,31,60,982
(Apr 2015 – Nov 2023)
INR 97,96,24,022
(Jan – Nov 2023)

Rajasthan
INR 17,93,67,53,735
(Apr 2015 – Nov 2023)
INR 89,78,12,972
(Jan – Nov 2023)

Tamil Nadu
INR 10,47,78,22,604
(Apr 2015 – Nov 2023)
INR 5,56,08,49,825
(Jan – Nov 2023)

Telangana
INR 4,35,87,93,571
(Apr 2015 – Nov 2023)
INR 3,27,31,73,835
(Jan – Nov 2023)

Tripura
INR 1,84,68,315
(Apr 2015 – Nov 2023)
INR 1,83,58,282
(Jan – Nov 2023)

Uttar Pradesh
INR 12,90,36,77,092
(Apr 2015 – Nov 2023)
INR 7,28,86,67,555
(Jan – Nov 2023)

Uttarakhand
INR 6,84,01,38,135
(Apr 2015 – Nov 2023)
INR 4,49,47,65,348
(Jan – Nov 2023)

West Bengal
INR 29,18,91,535
(Apr 2015 – Nov 2023)
INR 16,90,99,091
(Jan – Nov 2023)
07/
Target Cohorts
Most of the beneficiaries we work with are part of the informal sector. This includes agricultural workers, construction workers, micro-enterprise owners, ‘migrant workers’, and various other workers involved in a range of manufacturing and service occupations. Welfare programmes for the unorganised sector are often tied to the type of work performed, so they can be designed to cater to the sector-specific needs of target groups.
Our work has enhanced the accessibility of documents and identity and occupation-linked welfare schemes for various target groups. We conduct outreach and awareness-building activities through corporate and non-profit organisations focusing on critical and excluded groups of individuals. HQ’s work impacts various target cohorts — from farmers to sanitation workers, and now even the LGBTQIA+ community.

Construction Workers
INR 1,68,63,18,20,691
(Apr 2015 – Nov 2023)
INR 3,19,99,69,264
(Jan – Nov 2023)
Roller drivers, construction site accountants/clerks, well diggers, welders, mixermen/spraymen, tilers, railwork labourers, ‘raj mistries’, roof builders, mosaic polish workers, road builders, lift builders/stairs builders, community park and sidewalk makers, kitchen modular unit workers, tunnel workers, stone workers, masons, painters, carpenters, fitters, and other construction workers.

Sanitation Workers
INR 23,23,19,90,214
(Apr 2015 – Nov 2023)
INR 10,37,26,754
(Jan – Nov 2023)
Manual scavengers, rag pickers, waste pickers, waste collection unit workers, and other sanitation workers.

Agriculture and Plantation Workers
INR 1,10,58,36,41,022
(Apr 2015 – Nov 2023)
INR 19,26,31,16,503
(Jan – Nov 2023)
Farmers, farm laborers, dairy farmers, poultry farmers, ‘kendu’ leaf collectors, fishermen, animal husbandry workers, coconut tree climbers, toddy tappers, tea plantation workers, shepherds, and other workers.

Factory Workers
INR 91,87,33,54,219
(Apr 2015 – Nov 2023)
INR 36,99,61,501
(Jan – Nov 2023)
Stone crushers, mine workers, papad rollers, Iron ore workers, Manganese Ore workers, Chrome ore workers, Mica mine workers, Dolomite mine workers, brick factory workers, Limestone mine workers, lime industry workers, papad rollers, and other factory workers.

Sex Workers
INR 77,15,256
(Apr 2015 – Nov 2023)
INR 54,12,448
(Jan – Nov 2023)

Other Informal Workers
INR 2,57,26,01,66,757
(Apr 2015 – Nov 2023)
INR 27,58,24,42,999
(Jan – Nov 2023)
Fabricators, rickshaw drivers, tanners, flayers, salt workers, workers who engage in the sale/distribution of illegal liquor, handicraftsmen/‘dastkar’, artisans, leather workers, cobblers, cine workers, licensed railway porters, auto/taxi drivers, Anganwadi workers, Anganwadi helpers, teachers, shop workers, plumber, electrician, divers, iron smiths, blacksmiths, hammer-smiths, pump operators, soil workers, coir workers, tailors, bonded labour, contractual labour (excluding BOCW and ESI registered workers), daily wage porters, lorry drivers, bus drivers, maxi-cab drivers, watchmen, security guards, barbers, ‘dhobis’, beauticians, and other unorganised workers.

Textile Workers
INR 20,30,21,36,588
(Apr 2015 – Nov 2023)
INR 2,41,85,204
(Jan – Nov 2023)
Powerloom workers, handloom weavers, and other textile workers.

Domestic Workers
INR 4,95,23,60,062
(Apr 2015 – Nov 2023)
INR 1,12,92,62,350
(Jan – Nov 2023)

MSMEs and Associated Workers
INR 91,64,12,08,986
(Apr 2015 – Nov 2023)
INR 38,18,69,960
(Jan – Nov 2023)
Street vendors, vegetable vendors, fish sellers, fruit sellers, flower sellers, garland sellers, petty merchants, ration shop dealers, newspaper hawkers, milk vendors, and other MSMEs.

Trans Citizens
INR 8,99,54,892
(Apr 2015 – Nov 2023)
INR 2,70,12,597
(Jan – Nov 2023)
